qml.drawer.draw_mpl
-
draw_mpl(qnode, wire_order=None, show_all_wires=False, decimals=None, expansion_strategy=None, style=None, *, fig=None, **kwargs)[source]¶ Draw a qnode with matplotlib
- Parameters
qnode (QNode or Callable) – the input QNode/quantum function that is to be drawn.
- Keyword Arguments
wire_order (Sequence[Any]) – the order (from top to bottom) to print the wires of the circuit. If not provided, the wire order defaults to the device wires. If device wires are not available, the circuit wires are sorted if possible.
show_all_wires (bool) – If True, all wires, including empty wires, are printed.
decimals (int) – How many decimal points to include when formatting operation parameters. Default
Nonewill omit parameters from operation labels.style (str) – visual style of plot. Valid strings are
{'black_white', 'black_white_dark', 'sketch',
'pennylane', 'pennylane_sketch', 'sketch_dark', 'solarized_light', 'solarized_dark', 'default'}
. If no style is specified, the global style set withuse_style()will be used, and the initial default is ‘black_white’. If you would like to use your environment’s current rcParams, setstyleto “rcParams”. Setting style does not modify matplotlib global plotting settings.fontsize (float or str) – fontsize for text. Valid strings are
{'xx-small', 'x-small', 'small', 'medium', large', 'x-large', 'xx-large'}. Default is14.wire_options (dict) – matplotlib formatting options for the wire lines
label_options (dict) – matplotlib formatting options for the wire labels
active_wire_notches (bool) – whether or not to add notches indicating active wires. Defaults to
True.expansion_strategy (str) –
The strategy to use when circuit expansions or decompositions are required.
gradient: The QNode will attempt to decompose the internal circuit such that all circuit operations are supported by the gradient method.device: The QNode will attempt to decompose the internal circuit such that all circuit operations are natively supported by the device.
fig (None or matplotlib.Figure) – Matplotlib figure to plot onto. If None, then create a new figure
- Returns
A function that has the same argument signature as
qnode. When called, the function will draw the QNode as a tuple of (matplotlib.figure.Figure,matplotlib.axes._axes.Axes)
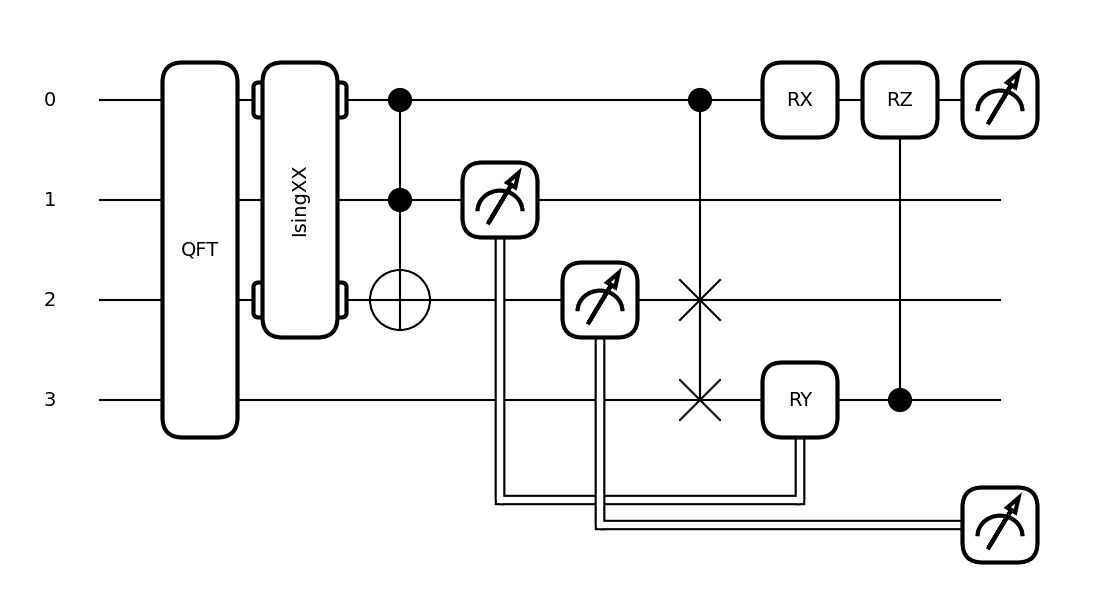
Example:
dev = qml.device('lightning.qubit', wires=(0,1,2,3))

@qml.qnode(dev)
def circuit(x, z):
    qml.QFT(wires=(0,1,2,3))
    qml.IsingXX(1.234, wires=(0,2))
    qml.Toffoli(wires=(0,1,2))
    mcm = qml.measure(1)
    mcm_out = qml.measure(2)
    qml.CSWAP(wires=(0,2,3))
    qml.RX(x, wires=0)
    qml.cond(mcm, qml.RY)(np.pi / 4, wires=3)
    qml.CRZ(z, wires=(3,0))
    return qml.expval(qml.Z(0)), qml.probs(op=mcm_out)


fig, ax = qml.draw_mpl(circuit)(1.2345,1.2345)
fig.show()
Usage Details
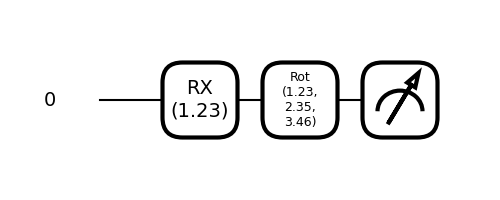
Decimals:
The keyword
decimalscontrols how many decimal points to include when labelling the operations. The default valueNoneomits parameters for brevity.@qml.qnode(dev) def circuit2(x, y): qml.RX(x, wires=0) qml.Rot(*y, wires=0) return qml.expval(qml.Z(0)) fig, ax = qml.draw_mpl(circuit2, decimals=2)(1.23456, [1.2345,2.3456,3.456]) fig.show()
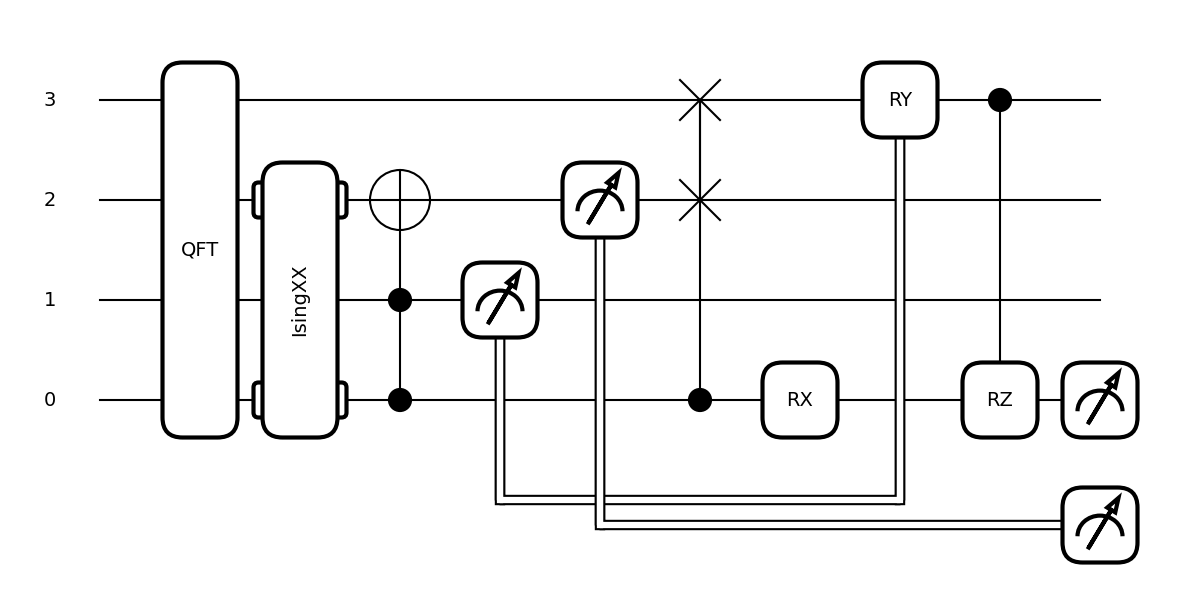
Wires:
The keywords
wire_orderandshow_all_wirescontrol the location of wires from top to bottom.fig, ax = qml.draw_mpl(circuit, wire_order=[3,2,1,0])(1.2345,1.2345) fig.show()
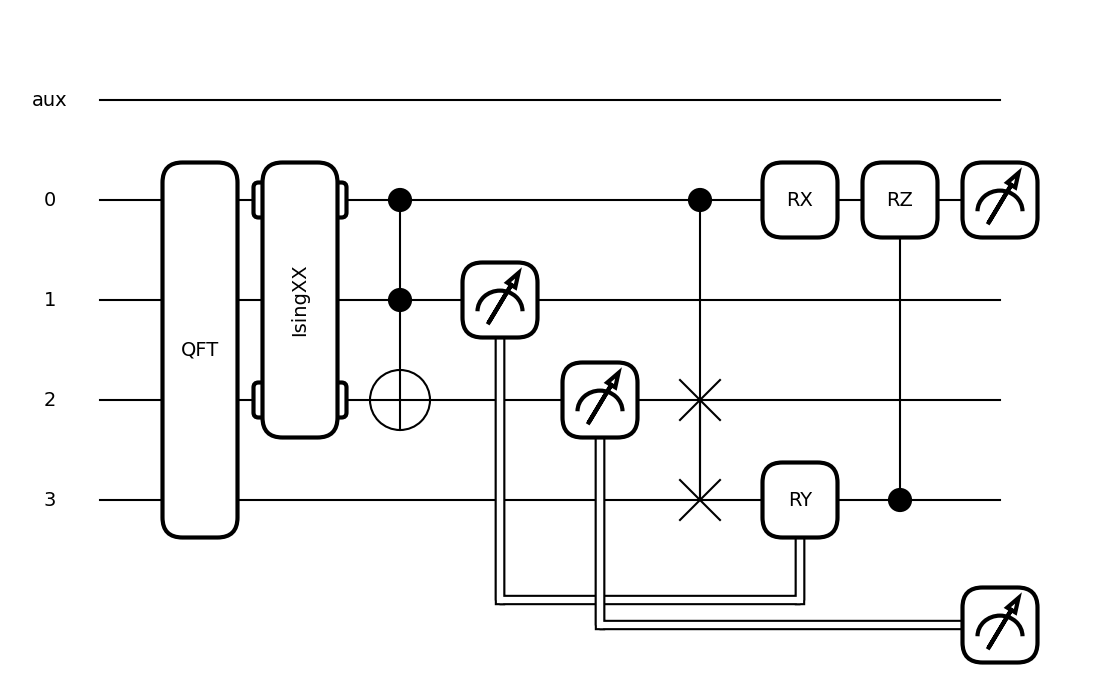
If a wire is in
wire_order, but not in thetape, it will be omitted by default. Only by selectingshow_all_wires=Truewill empty wires be displayed.fig, ax = qml.draw_mpl(circuit, wire_order=["aux"], show_all_wires=True)(1.2345,1.2345) fig.show()
Integration with matplotlib:
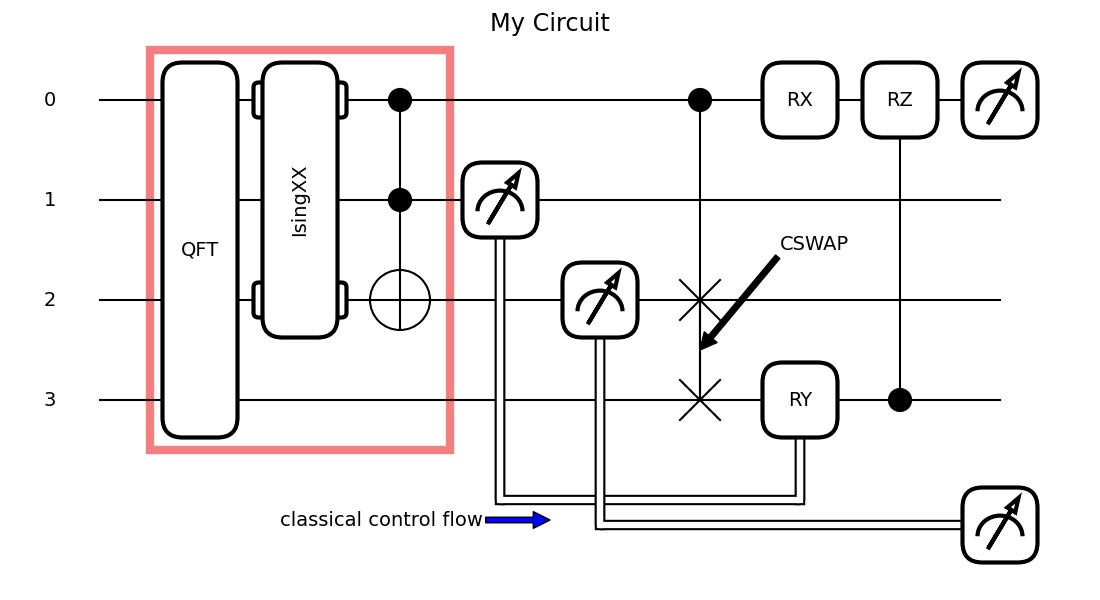
This function returns matplotlib figure and axes objects. Using these objects, users can perform further customization of the graphic.
fig, ax = qml.draw_mpl(circuit)(1.2345,1.2345)
fig.suptitle("My Circuit", fontsize="xx-large")

options = {'facecolor': "white", 'edgecolor': "#f57e7e", "linewidth": 6, "zorder": -1}
box1 = plt.Rectangle((-0.5, -0.5), width=3.0, height=4.0, **options)
ax.add_patch(box1)

ax.annotate("CSWAP", xy=(5, 2.5), xycoords='data', xytext=(5.8,1.5), textcoords='data',
            arrowprops={'facecolor': 'black'}, fontsize=14)

ax.annotate("classical control flow", xy=(3.5, 4.2), xycoords='data', xytext=(0.8,4.2),
            textcoords='data', arrowprops={'facecolor': 'blue'}, fontsize=14,
            va="center")
fig.show()
Formatting:
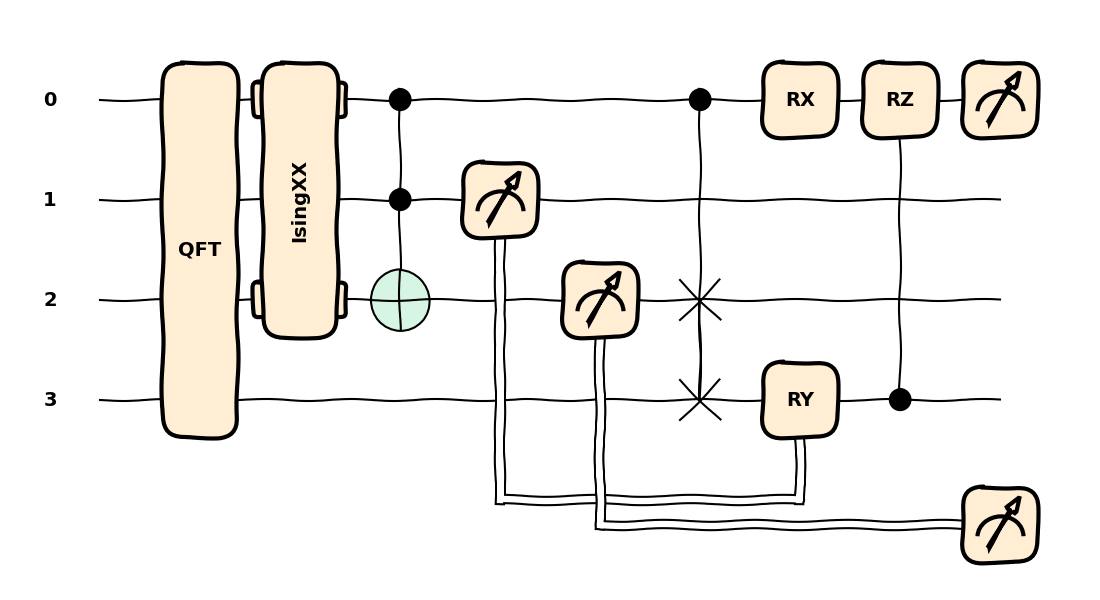
PennyLane has inbuilt styles for controlling the appearance of the circuit drawings. All available styles can be determined by evaluating
qml.drawer.available_styles(). Any available string can then be passed via the kwargstyleto change the settings for that plot. This will not affect style settings for subsequent matplotlib plots.fig, ax = qml.draw_mpl(circuit, style='sketch')(1.2345,1.2345) fig.show()
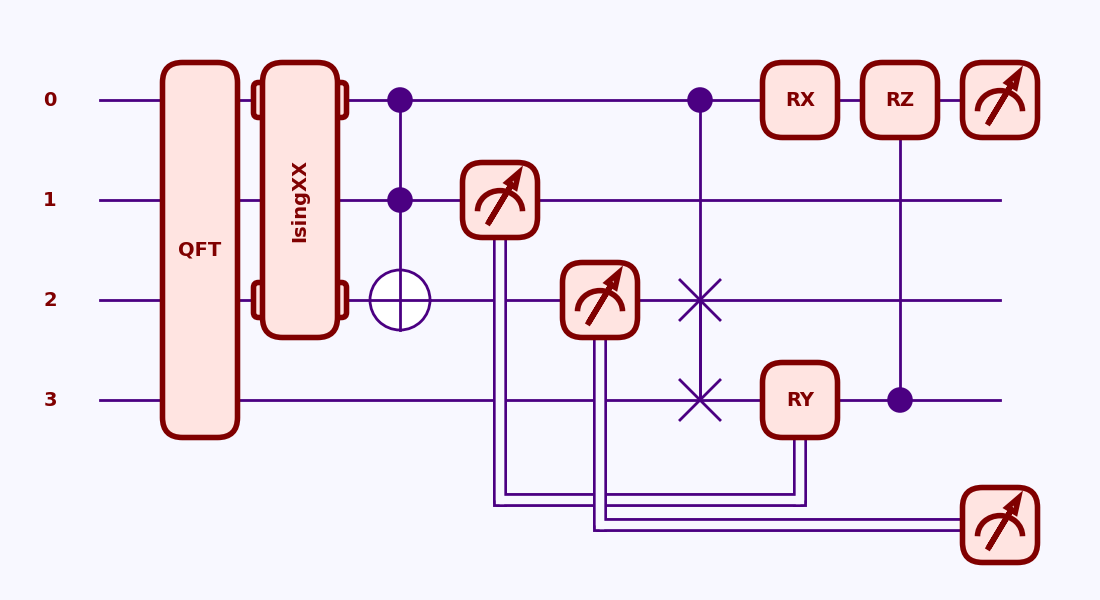
You can also control the appearance with matplotlib’s provided tools, see the matplotlib docs . For example, we can customize
plt.rcParams. To use a customized appearance based on matplotlib’splt.rcParams,qml.draw_mplmust be run withstyle="rcParams":plt.rcParams['patch.facecolor'] = 'mistyrose' plt.rcParams['patch.edgecolor'] = 'maroon' plt.rcParams['text.color'] = 'maroon' plt.rcParams['font.weight'] = 'bold' plt.rcParams['patch.linewidth'] = 4 plt.rcParams['patch.force_edgecolor'] = True plt.rcParams['lines.color'] = 'indigo' plt.rcParams['lines.linewidth'] = 2 plt.rcParams['figure.facecolor'] = 'ghostwhite' fig, ax = qml.draw_mpl(circuit, style="rcParams")(1.2345,1.2345) fig.show()
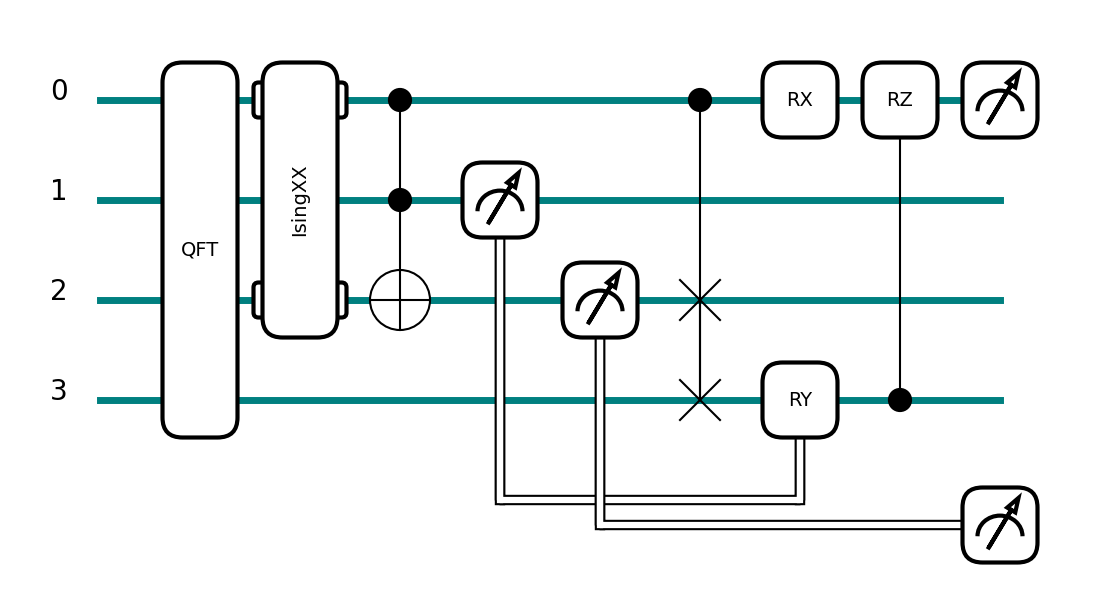
The wires and wire labels can be manually formatted by passing in dictionaries of keyword-value pairs of matplotlib options.
wire_optionsaccepts options for lines, andlabel_optionsaccepts text options.fig, ax = qml.draw_mpl(circuit, wire_options={'color':'teal', 'linewidth': 5}, label_options={'size': 20})(1.2345,1.2345) fig.show()